Chris Webster with a contribution from David Dawson
This document comprises the first two stages of a project to prepare an Archaeological Research Framework for the South West of England (SWARF). The Resource Assessment aims to describe the current state of knowledge of the archaeological resource in the historic counties of Gloucestershire, Somerset, Wiltshire, Dorset, Devon and Cornwall. It provides the basis for identifying gaps in our knowledge and thus research priorities for the future which form the Research Agenda. It has already brought together a wide range of people with an interest in the past of the region who otherwise seldom meet and will hopefully produce new partnerships to carry forward research.
The Archaeological Research Framework is a response to a perceived lack of directed academic enquiry in the majority of archaeological projects today, brought about by the development-led nature of most of the work. Archaeology has come a long way from its origins as an intellectual pastime of the landed and middle classes in the 19th century but, because of the way it developed after the Second World War, the location of most archaeological work in Britain today is tied to the planning process and development. Since the formalisation of requirements for archaeological work in PPG16 (DoE 1990) there has been a continual rise in the amount of archaeological work in the region (see Figure 1.1 and Figure 1.13). The popularity of television programmes devoted to archaeology, particularly Time Team, has never been higher and suggests significant public interest in certain aspects of the subject. Universities have also seen a significant rise (now falling again) in numbers of students which has led to an increased amount of fieldwork, although this is often directed away from local projects by the demands of the Research Assessment Exercise. Despite this increased interest and participation, however, the vast majority of archaeological investigation is driven by the needs of construction projects rather than research questions.
Recognising this situation in the early 1990s, English Heritage surveyed the work of professional archaeologists, resulting in the publication of Frameworks for our Past (Olivier 1996). This showed that there had been work on national research priorities but there were major gaps at more local levels: the levels at which the planning process works. It also criticised the methodology of previous frameworks which reflected strongly the interests of a limited number of authors and omitted significant areas in which the authors had no interests (Olivier 1996, 9). The result of this appraisal was the development of a programme of Regional Research Frameworks which would provide a context within which the development control archaeologist could consider work, sites outside the development control system could be evaluated and the funding from developers used to best effect (Olivier 1996, 2).
The production of this Archaeological Research Framework was initiated by the SW group of the Association of Local Government Archaeological Officers (SWALGAO) and English Heritage in 1996 which led to the production of a number of draft research objectives and agreement of the wider archaeological community to work towards a coherent Regional Research Framework for the South West following the model proposed in Frameworks for our Past.

In 2001 the project was re-awakened and it was agreed that SWALGAO should draw up a draft proposal for English Heritage. Two seminars (at Exeter and Swindon in December 2001) were attended by over 60 people, with 30 apologies, and proved to be an important first step in assessing the scope and scale of the Framework project. Invitations were sent to a wide range of the heritage sector in the South West and delegates attending the meeting came from a wide variety of backgrounds – universities, local authorities, contracting units, museums, local amenity societies and independent consultants. A project design was prepared by Bob Sydes (then of Bath and North East Somerset Council) but he was unable to complete the task for internal management reasons. A revised version was prepared by Bob Croft of Somerset County Council and submitted to English Heritage in December 2003. Following discussions with Kathy Perrin and Vanessa Straker of English Heritage in February 2004 a new version of the project design was prepared, following more closely the model established in other regions. This was agreed and work began in the summer.
The production of Research Frameworks falls into three phases as set out in Frameworks for our Past. The basis is an assessment of previous work and current knowledge, followed by the identification of gaps in knowledge and thus research priorities. The final phase is the production of a strategy to address these issues.
Phase 1: The Resource Assessment What we know
Phase 2: The Research Agenda What we would like to know
Phase 3: The Research Strategy How we are going to find out
The Research Framework, including the current document, has been written by archaeologists working in, or with an interest in, the archaeology of South West England. They comprise local authority archaeologists, academic archaeologists, archaeological contractors and amateur archaeologists who have collaborated in 8 period-based groups to produce a report under the editorship of a Group Convenor. The initial membership of the groups was suggested by SWALGAO but was then supplemented by other suggestions and volunteers. Input from others was welcomed and, indeed, encouraged.
The current document thus represents the collated texts from many authors and because of this it is not possible to identify the individual authorship of a block of text. The contributors to the text are given at the head of each section of the Resource Assessment and a full list of those involved is given in the Acknowledgements section.
The sections on the environmental background are slightly different. It did not prove possible to form a group of environmental specialists and thus almost all the work had to be undertaken by one person, Vanessa Straker. It was originally intended that this material should be produced first and incorporated into the writing of the period chapters but, because most of the work could not be shared out, in the event it was some of the last to be completed and most has had to be inserted with only a limited amount of integration.
The first version of the Resource Assessment was presented at a two-day seminar in Bristol in May 2005 and the Research Agenda a year later. Both meetings were open to all and allowed a wide range of views to be expressed, many of which are incorporated into this final version. The report thus boasts not only many authors but also a great many contributors from all sections of the archaeological community of the South West.
The region is that covered by the Government Office for the South West and comprises the historic counties of Gloucestershire, Somerset, Wiltshire, Dorset, Devon and Cornwall. For the most part the region reflects the historic boundaries of the counties but an area of Hampshire (around Christchurch) was transferred to Dorset in 1974. The county of Avon was also established in 1974 comprising the hinterland of Bristol and Bath but this has now been spilt into the unitary authorities of South Gloucestershire, Bristol, North Somerset, and Bath and North East Somerset. Five other unitary authorities have also been carved out of counties: Swindon, Bournemouth, Poole, Torbay and Plymouth. There are also two National Parks: Dartmoor in Devon, and Exmoor straddling the Devon/Somerset border. Together they cover around 3% of the region.
South West England is the largest of the nine English local government regions, covering an area of 23,837 km2 (18.3% of England). It is also the least compact, stretching for over 360km with the Isles of Scilly a further 50km beyond Land’s End. Tewkesbury, in the north, is about the same distance from Scotland as it is from Penzance in the West. Despite its size it has the third lowest population but is one of the most culturally diverse: from inner-city Bristol to the Isles of Scilly.
In the South West, the Historic Environment is one of the main drivers for the economy largely through tourism-linked activities. The archaeological and built heritage of the region adds to the character and quality of life of the South West. It will be important that all future planning, development regeneration, agrienvironment, social and cultural strategies acknowledge and take account of the context of archaeological research frameworks.
The South West contains most types of geological formation known in Britain from the granite of Dartmoor to the recent peats and clays of the Severn estuary (Figure 1.2).
Cornwall and Devon are dominated by the granite moors: Dartmoor, Bodmin Moor and smaller areas, including West Penwith and the Isles of Scilly. These areas are also the source of the minerals that have had a profound effect on life in the area. The higher lands are surrounded by lower rolling countryside, composed mostly of Devonian and Carboniferous sandstones. These rise to high moorland on Exmoor.
Much of Somerset and the Severn valley lies on Triassic marls and the mixed clays and limestones of the Lias. In the south the Greensand of the Blackdown Hills continues into Devon to reach the coast. To the east, in Dorset and eastern Somerset lies the ridge of Jurassic limestone which also forms the Cotswolds in the north. Much of Dorset lies on chalk with younger sediments in the areas around Poole Harbour. The chalk continues north to form much of Wiltshire, including the high areas of Salisbury Plain and the Marlborough Downs. Mendip and the area around Bristol contain areas of carboniferous limestones with coal measures that also continue across the Severn to form the Forest of Dean.
Many of the lower lying areas along the Severn are covered by recent marine sediments and peats formed as the sea level fluctuated. The effects of these changes are represented further west by the rias of the north, and particularly, south coasts of Devon and Cornwall. Many of these are choked in their higher reaches by alluvium caused by tin-streaming on the moors above.

In 1996 English Nature and the Countryside Commission (now combined as Natural England), with help from English Heritage, produced a map of England that depicts the natural and cultural dimensions of the landscape. Two categories were mapped: Natural Areas and Countryside Character. Natural Areas are biogeographic zones that reflect the geological foundation, the natural systems and processes and the wildlife in different parts of England. The Countryside Character Areas sometimes follow the Natural Areas boundaries and are described as “unique in terms of a combination of physiographic land use, historical and cultural attributes”. Concerns about the simplistic nature of the historical and cultural attributes used to define these areas led to English Heritage’s Historic Landscape Character analysis (below). The CCAs do, however provide a broad overview of landscape types and are shown in Figure 1.3. The regional boundary is also shown to indicate how poorly the region is defined, on its landward side, by the characterisation. There are 159 CCAs defined, of which 40 (25%) lie in whole, or part, in the South West. As the region covers only 18.3% of the land area of England this provides another indication of the diversity of the South West.

The origins of the current region lies with the military government imposed by Cromwell in 1655. Concern over potential rebellion led to the creation of a series of county militias which were grouped into regional associations. On 2nd August John Desborough was given command of the militia association covering Cornwall, Devon, Somerset, Dorset, Wiltshire and Gloucestershire with the rest of the country being divided up into a further 9 associations a week later. In September it was decided that the heads of the associations were to be called Major-Generals, would have (poorly defined) civilian powers and were to be funded by a new tax system (the decimation tax).
The system was deeply unpopular, not just because of the tax but also as many of the Major-Generals followed a strongly puritan agenda which attempted to rid the existing systems of local government of “ungodly” men. Despite attempts to rig the 1656 election, the parliament that assembled voted in January 1657 against making the decimation tax permanent and, deprived of the funding base, the system was abolished by Cromwell (Durston 2001), only to be revived in the years following the First World War.
The involvement of the whole population in the war effort was seen to require military-style government, and the threat of revolution (on the Russian model) was considered very real. The Emergency Powers Act 1920 enabled the appointment of District Commissioners to oversee this and the act was used to declare a state of emergency during the 1926 General Strike. The military district commanders were ordered to provide troops if the commissioners requested but in the event few of the powers were required. In 1938 this became the basis of the Civil Defence Emergency Scheme, again based on Regional Commissioners with wide powers, which was made public in February 1939 and became operational on 25th August. The commissioners remained in post until 1945 and were mainly involved with air-raid precautions although theywould have been able to take over the full (emergency) powers of central government if needed. The South Western region (also known as Region 7) was governed from Bristol and covered the same area as Desborough’s association and the current region with the exception of Dorset which lay in Region 6 (Campbell 1982; O’Brien 1955).
Three years after the system had been dismantled it was reactivated by the Civil Defence Act 1948 when it was decided that each region would have a purpose-built headquarters, a “War Room”, to provide protected accommodation for the Regional Commissioner and his staff. To reduce the danger from bombing the buildings were constructed just outside the cities and that for Region 7 survives at Brislington, near Bristol. By the time all were constructed in the later 1950s it was apparent that the threat from the hydrogen bomb meant that plans to coordinate relief to civilians were no longer tenable. Accordingly a new system of Regional Seats of Government was set up in the hope that an administrative system would survive a nuclear attack. The headquarters were moved away from population centres and Region 7 would have been governed from a converted Rotor project radar station, known as Hope Cove but in fact situated on nearby Bolt Head in southern Devon.
During the 1960s a system of Sub-Regional Headquarters was proposed in which the Bristol War Room and a former Anti-Aircraft Operations Room at Ullenwood in Gloucestershire were included. By the late 1960s the system had changed again so that only the sub-regions were provided with headquarters, called Sub-Regional Controls, based at Hope Cove (S-RC 7.1) and Ullenwood (S-RC 7.2). It is likely that Dorset joined Region 7 in a reorganisation of 1973. Civil defence was run down in the 1970s but increasing tension in towards the end of the decade led the Conservative government of 1979 to propose the creation of 17 new protected headquarters, to be known as Regional Government Headquarters (RGHQ). Under this plan Hope Cove and Ullenwood were upgraded and remained in use until 1985 when construction started on a new RGHQ at Chilmark. Following the collapse of the Soviet Union in 1992 the system of planned emergency government was run down (McCamley 2002; Cocroft and Thomas 2003).
Below this regional layer, local government retained a structure inherited from the last quarter of the 19th century until the reorganisation of 1974. This saw the creation of a two tier structure of counties and districts and a new county of Avon in the major population centre around Bristol and Bath. In the mid-1990s it was proposed to remove the two tier system but, in the event, this occurred in a piecemeal fashion. New “Unitary” authorities were created from the former districts within Avon, together with Plymouth, Torbay, Poole, Bournemouth and Swindon.
The regional emergency government structure was reused when government regional offices were set up in 1994 following the Maastricht Treaty of 1992 which foresaw a “Europe of the Regions”. This was followed by the creation of further regional organisations such as the Regional Development Agencies in 1998 and the regionalisation of organisations such as English Heritage. An unelected regional assembly was intended to be followed by an elected body (and single tier local government) but the rejection of this system by a referendum in the North East in 2004 put this on hold for the foreseeable future.
The South West contains 4 of the 17 World Heritage Sites designated by UNESCO in England: Stonehenge, Avebury and Associated Sites (1986), The City of Bath (1987), Dorset and East Devon Coast (2001) and Cornwall and West Devon Mining Landscape (2006), shown on Figure 1.4. Of these, Dorset and East Devon Coast is included for geological interest but the designation of the others is based on their historic environment. More details of World Heritage Sites are available at http://whc.unesco. org/pg.cfm?cid=1

The South West contains over a third of all the Scheduled Monuments in England although it covers only about one fifth of the area (Figure 1.5). According to the Record of Scheduled Monuments maintained by English Heritage there were 6972 Monuments (on 22/07/2004) from a total of about 19,000 (36.7%). Table 1.1 shows the break-down of these by local authority across the region.
| Authority | Monuments |
|---|---|
| Devon | 1718 |
| Cornwall | 1339 |
| Wiltshire | 1299 |
| Dorset | 1015 |
| Somerset | 602 |
| Gloucestershire | 464 |
| Isles of Scilly | 238 |
| North Somerset | 66 |
| Bath and North East Somerset | 56 |
| Swindon | 52 |
| Plymouth | 36 |
| South Gloucestershire | 31 |
| Bristol | 24 |
| Poole | 16 |
| Torbay | 13 |
| Bournemouth | 3 |
Much of the disparity in numbers between local authorities is obviously based on their vastly differing areas. The following table lists the number of monuments per square kilometre in each authority. The average for the region is 0.29 as shown by the line in Table 1.2. The high figure for Plymouth is due to a preference by the navy for historic buildings to be Scheduled rather than Listed.
Of these 6972 monuments, 4929 (70.7%) have been scheduled (or rescheduled) by the Monuments Protection Programme. The others retain their earlier (often much earlier) documentation which in some cases amounts only to a name and an outline map.

| Authority | Total | per km2 |
|---|---|---|
| Isles of Scilly | 238 | 10.23 |
| Plymouth | 36 | 0.76 |
| Wiltshire | 1299 | 0.40 |
| Dorset | 1015 | 0.40 |
| Cornwall | 1339 | 0.38 |
| Devon | 1718 | 0.26 |
| Swindon | 52 | 0.23 |
| Poole | 16 | 0.23 |
| Bristol | 24 | 0.22 |
| Torbay | 13 | 0.20 |
| North Somerset | 66 | 0.18 |
| Somerset | 602 | 0.18 |
| Gloucestershire | 464 | 0.17 |
| Bath and NE Somerset | 56 | 0.16 |
| South Gloucestershire | 31 | 0.06 |
| Bournemouth | 3 | 0.06 |
| 6972 |
There were 88,078 Listed Buildings in the region in July 2004 as shown in the distribution map (Figure 1.6). This represents 23.8% of the c. 370,000 in England, again above the expected value for a region of this size (18.3% by area). In many ways the distribution complements that of the Scheduled Monuments with obvious gaps on the moors and other areas where settlement is sparse. In other areas, for example the area between Exeter and Exmoor, it is less clear why there are fewer Listed Buildings than elsewhere. The pattern in Wiltshire is particularly clear with the buildings clearly indicating settlement along the river valleys.
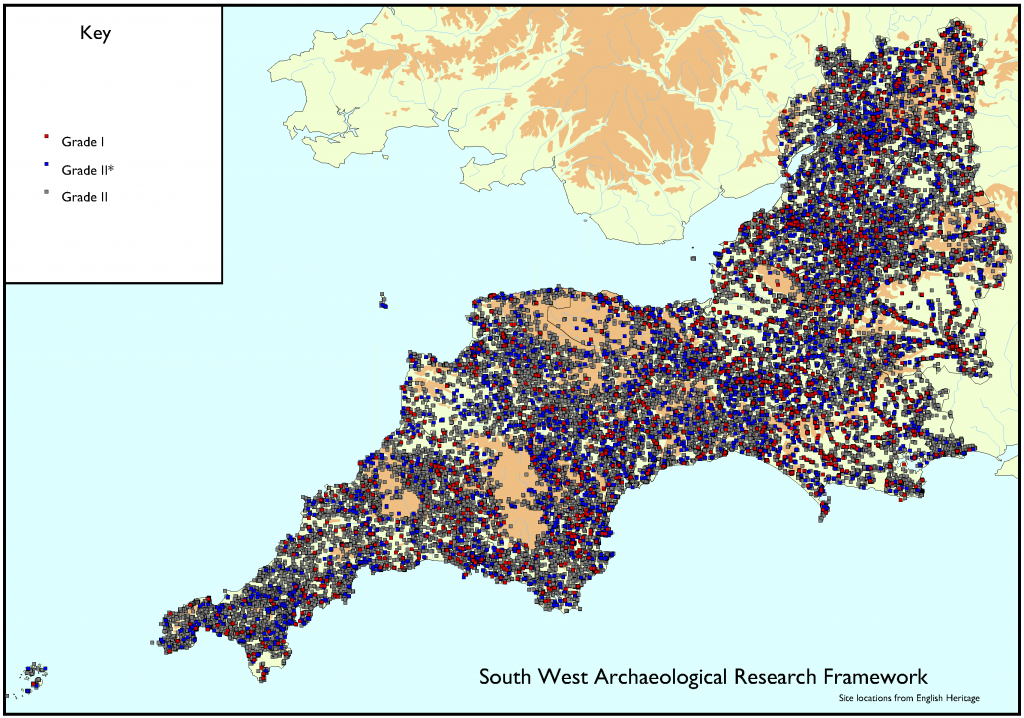
| Authority | Total | Grade I | Grade II* | Grade II |
|---|---|---|---|---|
| Devon | 30,246 | 392 | 1106 | 17,462 |
| Gloucestershire | 12,810 | 257 | 696 | 11,812 |
| Cornwall | 12,356 | 217 | 572 | 11,558 |
| Wiltshire | 12,231 | 271 | 680 | 11,163 |
| Somerset | 11,590 | 309 | 762 | 10,492 |
| Dorset | 9661 | 250 | 480 | 8679 |
| Bath and North East Somerset | 3034 | 99 | 128 | 2708 |
| Bristol | 2093 | 52 | 208 | 1833 |
| South Gloucestershire | 2030 | 44 | 119 | 1867 |
| North Somerset | 1040 | 37 | 76 | 918 |
| Torbay | 859 | 5 | 30 | 824 |
| Plymouth | 738 | 24 | 90 | 624 |
| Swindon | 642 | 14 | 27 | 601 |
| Bournemouth | 356 | 3 | 17 | 219 |
| Poole | 224 | 8 | 17 | 199 |
| Isles of Scilly | 129 | 4 | 8 | 117 |
| Total | 88,078 | 1986 | 4987 | 81,105 |
| Authority | Total | Grade I | Grade II* | Grade II |
|---|---|---|---|---|
| Bristol | 19.52 | 0.48 | 1.94 | 17.10 |
| Torbay | 13.36 | 0.07 | 0.46 | 12.82 |
| Plymouth | 9.74 | 0.31 | 1.18 | 8.23 |
| Bath and North East Somerset | 8.64 | 0.28 | 0.36 | 7.71 |
| Bournemouth | 7.26 | 0.06 | 0.34 | 4.47 |
| Isles of Scilly | 5.54 | 0.17 | 0.34 | 5.03 |
| Gloucestershire | 4.81 | 0.09 | 0.26 | 4.44 |
| Devon | 4.63 | 0.06 | 0.16 | 2.67 |
| South Gloucestershire | 4.19 | 0.09 | 0.24 | 3.86 |
| Dorset | 3.78 | 0.09 | 0.18 | 3.39 |
| Wiltshire | 3.75 | 0.08 | 0.20 | 3.42 |
| Cornwall | 3.51 | 0.06 | 0.16 | 3.28 |
| Somerset | 3.37 | 0.09 | 0.22 | 3.05 |
| Poole | 3.19 | 0.11 | 0.24 | 2.83 |
| North Somerset | 2.88 | 0.10 | 0.21 | 2.54 |
| Swindon | 2.84 | 0.06 | 0.11 | 2.66 |
The numbers of Listed Buildings in each local authority are shown in Table 1.3. Although the density of the distribution map obscures this, the Listed Buildings are primarily urban as is shown in Table 1.4 where the small urban authorities rise up the rankings because of the density of buildings in their area. The average density over the whole region is 3.70 buildings per km2 as shown by the line in Table 1.4. The table is ordered by the total density but examination of the data split by grade shows some interesting anomalies, for instance the high numbers of Grade II* buildings in Plymouth and the low numbers of Grade I in Torbay, when compared to the overall density.
There are 8 battlefields entered in the English Heritage Register of Battlefields out of a total of 43 (18.6%) which is only marginally above the number expected for a region of this size (18.3% by area). All the battles occurred during the Civil War with the exceptions of Tewkesbury (1471) and Sedgemoor, the last battle fought on English soil in 1685. The locations of the battlefields are shown in Figure 1.7.

| Authority | Number |
|---|---|
| Cornwall | 2 |
| Gloucestershire | 2 |
| Somerset | 2 |
| South Gloucestershire | 1 |
| Wiltshire | 1 |
The South West contains 292 (18.4%) of the 1587 sites on the English Heritage Register of Parks and Gardens which is very close to the expected value for a region of this size (18.3% by area). The locations of the sites are shown in Figure 1.8. The numbers of registered sites per authority is shown in Authority Battlefields in Table 1.6 and the density in Table 1.7.

| Authority | Total | I | II* | II |
|---|---|---|---|---|
| Gloucestershire | 54 | 7 | 30 | 17 |
| Devon | 40 | 4 | 25 | 11 |
| Somerset | 38 | 5 | 22 | 11 |
| Wiltshire | 36 | 5 | 21 | 10 |
| Cornwall | 36 | 3 | 21 | 12 |
| Dorset | 31 | 2 | 14 | 15 |
| Bath and NE Somerset | 13 | 1 | 9 | 3 |
| North Somerset | 8 | 5 | 3 | |
| Bristol | 8 | 4 | 4 | |
| Torbay | 6 | 5 | 1 | |
| South Gloucestershire | 6 | 1 | 2 | 3 |
| Plymouth | 6 | 5 | 1 | |
| Poole | 3 | 2 | 1 | |
| Swindon | 2 | 2 | ||
| Bournemouth | 2 | 2 | ||
| Isles of Scilly | 1 | 1 | ||
| Totals | 290 | 29 | 167 | 94 |
| Authority | per km2 |
|---|---|
| Torbay | 0.09 |
| Plymouth | 0.08 |
| Bristol | 0.07 |
| Isles of Scilly | 0.04 |
| Poole | 0.04 |
| Bournemouth | 0.04 |
| Bath and North East Somerset | 0.04 |
| North Somerset | 0.02 |
| Gloucestershire | 0.02 |
| South Gloucestershire | 0.01 |
| Dorset | 0.01 |
| Somerset | 0.01 |
| Wiltshire | 0.01 |
| Cornwall | 0.01 |
| Swindon | 0.01 |
| Devon | 0.01 |
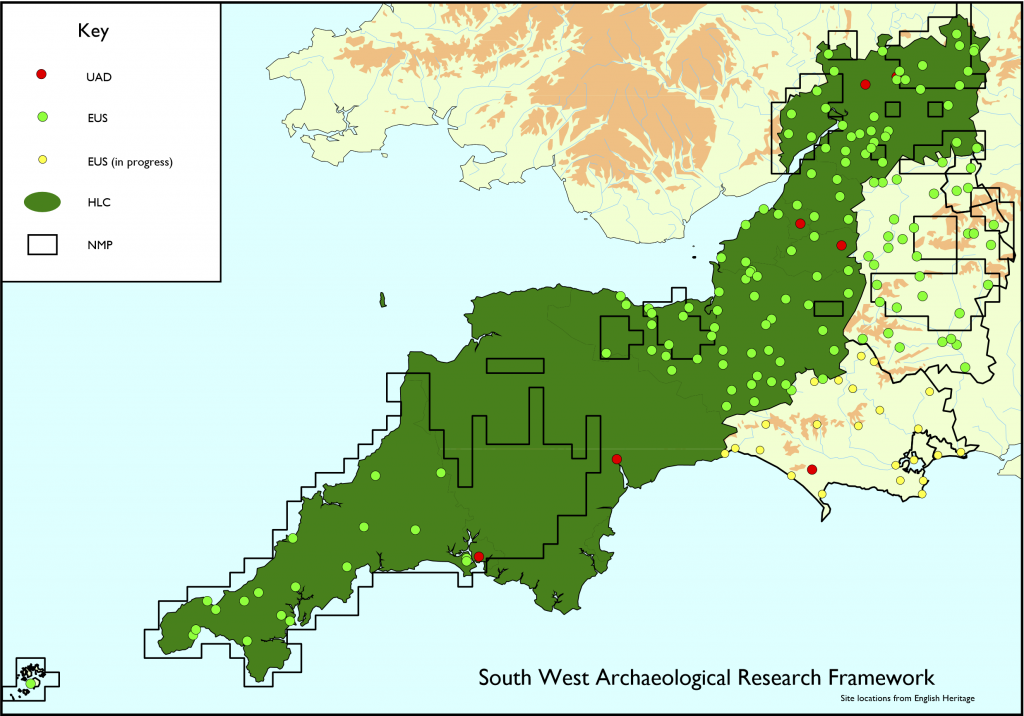
Urban Archaeological Databases Seven of the region’s historic towns have UADs as shown on Figure 1.9. The current status of these projects is shown in Table 1.8. The databases are usually situated in the planning departments of the local authority and divorced from the surrounding HER (see below). They also cover only a rectangular area around the “historic core” of the town so that there is often an area around this that is less well recorded.
| Town | UAD status |
|---|---|
| Cirencester | Paper-based record only |
| Gloucester | Data collection completed |
| Bristol | Data collection and assessment completed |
| Bath | Data collection complete to 1998, assessment in draft, strategy nearly complete, Planning Guidance adopted. |
| Exeter | Data collection completed |
| Plymouth | Data collection completed |
| Dorchester | Data collection almost completed |
Extensive Urban Surveys This English Heritage project covered the smaller urban areas and did not attempt to catalogue all urban deposits in the way that a UAD did. The projects researched previous work in the towns and attempted to characterise the buried archaeology into areas, mapped by GIS. The location of the towns covered by the survey is shown on Figure 1.9. The reports for Somerset have been published on the web (http://www.somerset.gov.uk/heritage) as have those of the similar project in Cornwall, targeting 19 towns that are likely to be affected by regeneration projects (http://www.historic-cornwall.org.uk). The others exist only as “grey literature”.
Historic Landscape Characterisation HLC projects funded by English Heritage have been undertaken over the northern and western parts of the region (Figure 1.9). Cornwall was one of the areas used to develop the methodology and because of this, is in a slightly different form to those carried out later. Each HLC project was then modified locally, so that a there is a degree of consistency lacking across the region.
National Mapping Programme The National Mapping Programme (NMP) grew out of Royal Commission on the Historical Monuments of England projects to map large areas of archaeological remains visible on aerial photographs. Following pilot projects the programme started in 1990. Some of the work is carried out by staff in the National Monuments Record whilst other work is carried out by local authorities, such as Cornwall and Gloucestershire. The areas covered in the South West are shown in Figure 1.9 and these comprise 35% of the region although work is ongoing in some areas. In addition Wiltshire County Council has had a long established practice of mapping aerial photographic evidence.
The entire region is covered by local authority based Historic Environment Records — some retain the original name of Sites and Monuments Record (or Register in the case of Devon). For the sake of brevity they will usually be referred to as HERs in the following text. Most of the HERs were set up in the 1970s and were based in the county tier of local authorities created in 1974. Subsequent reorganisation has seen this structure broken; some of the Unitary Authorities created in the 1990s have taken over their part of the record whilst others have entered service level agreements with their former county as shown in Table 1.9.
| Authority | HER |
|---|---|
| Gloucestershire | HER |
| South Gloucester | HER (former Avon) |
| Bristol | HER (former Avon) |
| North Somerset | HER (former Avon) |
| Bath and NE Somerset | HER (former Avon) |
| Somerset | HER |
| Wiltshire | HER |
| Swindon | Wiltshire HER |
| Dorset | HER |
| Bournemouth | Dorset HER |
| Poole | Dorset HER |
| Devon | HER |
| Torbay | HER |
| Plymouth | HER |
| Cornwall | HER |
| Isles of Scilly | Joint service with Cornwall HER |
Exeter and Gloucester maintain their own HERs based around the Urban Archaeological Database. Dartmoor National Park has recently agreed to maintain its own HER as part of a database hosted by Devon County Council. Exmoor’s situation is complicated as it is covered by the Devon and Somerset HERs and also has a database supplied by English Heritage, originally populated with a copy of the National Monuments Record data for the park.
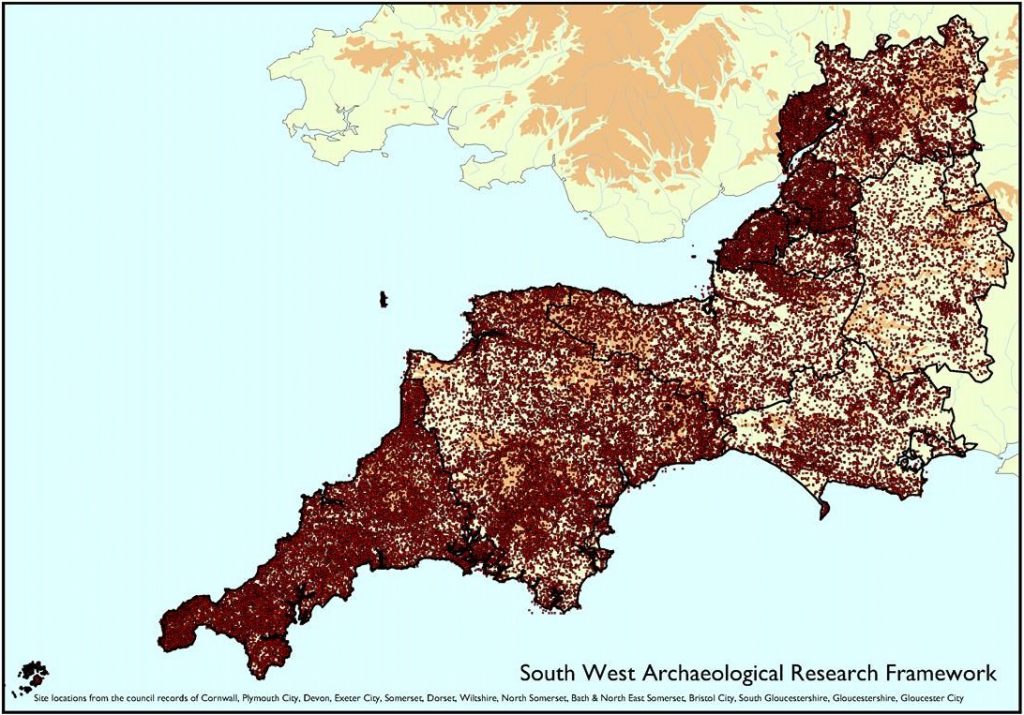

As part of the SWARF project, data was collected from the HERs, classified into periods and by monument class (as defined in the English Heritage Thesaurus of Monument Types, available at http://www.english-heritage.org.uk/ thesaurus/. The data returned comprised over 172,000 records of sites, stray finds and buildings. It should be noted that multi-period sites will appear multiple times and the number of unique locations is just over 110,000. Using this measure, the numbers of sites recorded by each record is shown in Table 1.10 and the density of sites in Table 1.11. The average density is 4.61, shown by a line on the table.
| HER | Records |
|---|---|
| Devon | 56,295 |
| Gloucestershire | 35,548 |
| Cornwall | 29,588 |
| Somerset | 14,196 |
| Dorset | 10,285 |
| South Gloucestershire | 9037 |
| North Somerset | 6404 |
| Wiltshire | 4268 |
| Bristol | 2336 |
| Plymouth | 1933 |
| Bath and North East Somerset | 1722 |
| Torbay | 1355 |
| Exeter | 900 |
| Gloucester | 545 |
| HER | Records per km2 |
|---|---|
| Plymouth | 25.52 |
| Bristol | 21.80 |
| Torbay | 21.09 |
| South Gloucestershire | 18.69 |
| North Somerset | 17.75 |
| Gloucestershire | 13.36 |
| Devon | 8.63 |
| Cornwall | 8.42 |
| Bath and North East Somerset | 4.91 |
| Somerset | 4.13 |
| Dorset | 4.02 |
| Wiltshire | 1.31 |
Distribution maps of HER records by period can be found in the summary reports prepared following discussions with local authority archaeologists (Webster 2004a;b;c;d;e;f;g;h;i;j). Not all HERs record the same information (for example the Wiltshire HER does not record systematically sites more recent than 1700) but Figure 1.10 shows the total distribution of sites. Much of the detail is obscured by the large numbers but some patterns do stand out. The high density of sites in North Somerset, for example, is due to an active Defence of Britain Project and the recent survey work HER Records in the Forest of Dean is also apparent. The difference in site density across the Devon/Cornwall boundary is a result of the National Mapping Programme of aerial photography in Cornwall.
The HERs also have markedly different profiles when the number of sites per period is examined. This HER Records per km2 is shown in Figure 1.11 and is a reflection of both the archaeological resource and the recording policy of the HER. Dorset and Wiltshire show a clear bias towards the prehistoric as compared to the more westerly HERs and contain very few monuments more recent than the Medieval period. In contrast, a city record such as Plymouth’s or Bristol’s contains almost entirely Post-Medieval to Modern monument records. The same data is shown in Figure 1.12 as numbers of sites per square kilometre. Again the difference between urban and rural areas is obvious.
The amount of planning-related archaeology can be assessed from the work of the English Heritage funded Archaeological Investigations Project (AIP) at Bournemouth University which has carried out an annual count by visiting each HER and contracting unit in England. Just under 8000 records were returned from the AIP for the South West which show the fast growth in the amount of archaeological work across the region (Figure 1.1) during the 1990s and a decrease since the turn of the millennium.
The data can also be presented as a distribution map (Figure 1.13) showing the types of activity across the region. This appears to show somesharp differences in curatorial practice, for example the relatively low numbers of “Environmental Statements” (which appears to include “watching briefs” in AIP terminology) in Devon compared to adjacent areas. Whereas “post-determination and nonplanning” appears to show the opposite. It is possible that this is due to differences in recording practice (the same AIP recorder tended to go to each HER) but this seems less likely than differences in approach by the local authority archaeologists. Curiously a similar pattern is observable in Swindon which (apart from a short period) is covered by Wiltshire County Council and might be expected to show an identical pattern to the surrounding area.
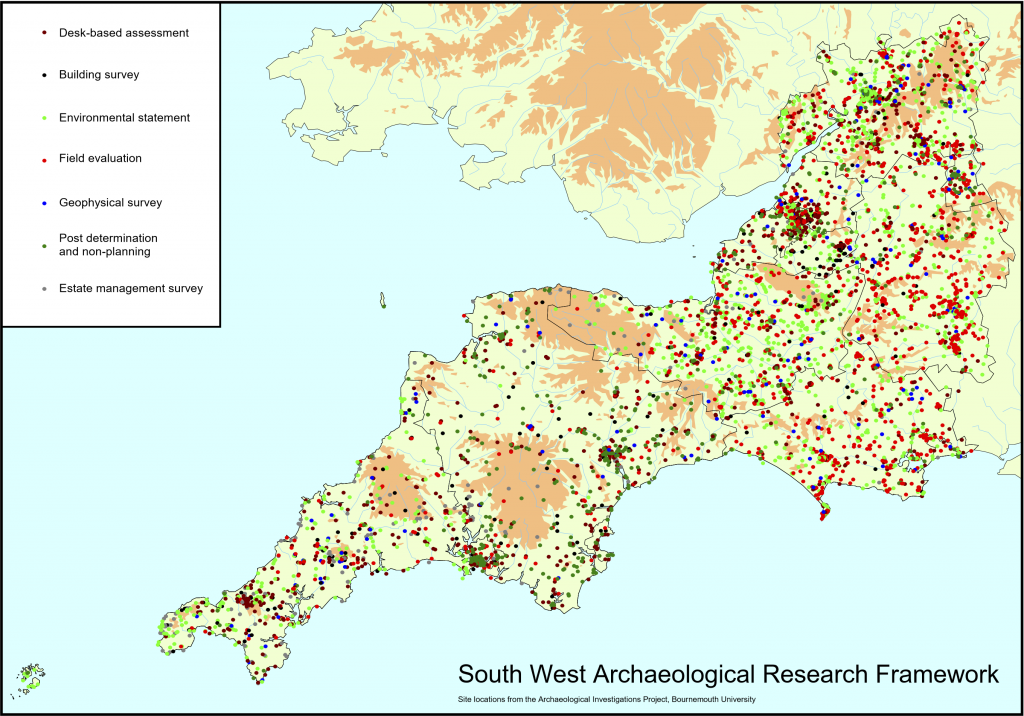

Otherwise the distribution across local authorities is similar to others presented here; there is more work in the urban authorities because of the concentration of archaeological deposits and the amount of development. The breakdown is shown in Table 1.12 and is shown as density in Table 1.13. The average density for the region is 0.33 per km2 and shown as a dotted line in the figure. The final illustration (Figure 1.14) shows the number of activities through time in the various local authorities which again shows some interesting differences, presumably reflecting development pressures.
| Total | Building Survey | Assessment | Environmental Statement | Estate Plan | Evaluation | Geophysical Survey | Other | |
| Gloucestershire | 1933 | 13 | 262 | 886 | 21 | 638 | 37 | 76 |
| Somerset | 1246 | 18 | 80 | 683 | 19 | 373 | 29 | 44 |
| Wiltshire | 1105 | 20 | 102 | 384 | 4 | 502 | 35 | 58 |
| Cornwall | 884 | 73 | 233 | 303 | 122 | 90 | 32 | 31 |
| Devon | 839 | 64 | 246 | 22 | 29 | 142 | 23 | 295 |
| Dorset | 832 | 10 | 151 | 282 | 6 | 328 | 24 | 31 |
| Bristol | 462 | 51 | 170 | 116 | 1 | 98 | 8 | 18 |
| Plymouth | 174 | 16 | 38 | – | 6 | 63 | – | 51 |
| BaNES | 162 | 28 | 29 | 56 | 5 | 37 | 3 | 4 |
| S Gloucestershire | 153 | 14 | 38 | 10 | 2 | 46 | 10 | 33 |
| North Somerset | 94 | 4 | 30 | 1 | 4 | 29 | 3 | 23 |
| Torbay | 31 | 5 | 11 | – | – | 5 | – | 10 |
| Total | Building Survey | Assessment | Environmental Statement | Estate Plan | Evaluation | Geophysical Survey | Other | |
| Bristol | 4.32 | 0.48 | 1.59 | 1.08 | 0.01 | 0.92 | 0.07 | 0.17 |
| Plymouth | 2.29 | 0.21 | 0.50 | – | 0.08 | 0.83 | – | 0.67 |
| Gloucestershire | 0.72 | – | 0.10 | 0.33 | 0.01 | 0.24 | 0.01 | 0.03 |
| Torbay | 0.48 | 0.08 | 0.17 | – | – | 0.08 | – | 0.16 |
| BaNES | 0.45 | 0.08 | 0.08 | 0.15 | 0.01 | 0.10 | 0.01 | 0.01 |
| Somerset | 0.36 | 0.01 | 0.02 | 0.20 | 0.01 | 0.11 | 0.01 | 0.01 |
| Wiltshire | 0.32 | 0.01 | 0.03 | 0.11 | – | 0.14 | 0.01 | 0.02 |
| S. Gloucestershire | 0.32 | 0.03 | 0.08 | 0.02 | – | 0.09 | 0.02 | 0.07 |
| Dorset | 0.31 | – | 0.06 | 0.11 | – | 0.12 | 0.01 | 0.01 |
| North Somerset | 0.26 | 0.01 | 0.08 | – | 0.01 | 0.08 | 0.01 | 0.06 |
| Cornwall | 0.25 | 0.02 | 0.07 | 0.09 | 0.03 | 0.03 | 0.01 | 0.01 |
| Devon | 0.13 | 0.01 | 0.04 | – | – | 0.02 | – | 0.05 |
There are 88 archaeological collections in the South West containing over 6.3 million items. For historical reasons, the major collections – those that would almost certainly comprise the dispersed national archaeological collection in the South West – are held in the county, city and town museums founded by philosophical, archaeological and natural history societies in the early to mid-19th century. They comprise the Royal Institution of Cornwall (Truro), Plymouth City Museum, the Museum of Barnstaple and North 2004).
Devon, Torquay Museum, Exeter City Museum, Dorset County Museum (Dorchester), Somerset County Museum (Taunton), Bristol City Museum, Gloucester City Museum, Wiltshire Heritage Museum (Devizes) and Salisbury and South Wiltshire Museum. Other significant excavated collections are held at the Corinium Museum (Cirencester), Roman Baths Museum (Bath), University of Bristol Spelaeological Society, Glastonbury Abbey, Wells Cathedral and Wells Museum with smaller collections of local significance held by a scatter of local museums all over the region.
Many, those with dedicated archaeological staff, were designated archaeological repositories under the late-lamented, English Heritage/Museums and Galleries Commission scheme. Only the archaeological collections per se of the Roman Baths Museum and the two Wiltshire museums designated as of national significance in the Museums, Libraries and Archives Council (MLA) scheme. All are still collecting and are participating in the Portable Antiquities Recording Scheme.
Taken together, they care for a major archaeological resource which has limitless potential for informing future research:
Collections also exist outside museums. Some are in the care of other types of heritage organisation and, as such, in many cases adhere to the minimum standards of care and accessibility of the Accreditation Scheme of the MLA. Others are awaiting possible transfer to museums. The value of museum collections is highly dependent on continuing public funding, general support and use by the archaeological community as well as adherence to the guidance, subscribed to by all archaeological organisations, which is intended to ensure archives are preserved and made accessible to the public for study, education and enjoyment.
To illustrate these points in further detail, the significance of this resource to the Post-Medieval and Modern periods can be summarised as follows:
Bristol City Museum and Art Gallery contains significant Post-Medieval and Modern, particularly industrial and maritime, collections. The three other major archaeological Post-Medieval and numismatic collections of both excavated assemblages and type reference material are held by the Royal Albert Memorial Museum, Exeter, Somerset County Museums Service, Taunton, and the Museum of North Devon, Barnstaple. There are smaller but significant collections in Plymouth and all the main county and a number of smaller museums such as Glastonbury Abbey, Poole Museum and Wells Museum. Whilst there is significant amount of material published (see Section 14.1), there is a substantial amount that remains either unprocessed or only partially processed and unpublished. A particular embarrassment of international proportions is the material excavated from pottery production sites in North Devon where so far only one, at Great Torrington, is being addressed.
For the Modern period, material is scattered over the region although there are relatively few systematic collections such as the Pitt-Rivers collection at Salisbury, the Devon life collections at Torquay and the industrial and maritime collections at Bristol. Military history and technology is well represented by a network of museums across the region of which the Tank Museum at Bovington and the Fleet Air Arm Museum are quasi-national institutions. Again, apart from military hardware, relatively few systematic studies have been published. For this period, there is a number of assemblages of artefacts that have been consciously preserved in situ. Most are domestic in character – almost all associated with the great houses of the wealthy in the care of a number of organisations, principally the National Trust. Some are working environments such as Geevor Mine in Cornwall and Sticklepath Foundry in Devon where not only machinery but the paraphernalia of working life have been kept.
Whilst for both periods publication is rare – Peter Brears’ study of the Devon life collections at Torquay is an outstanding exception – the development of the internet offers greater scope for publication, both in terms of checklists of excavation and fieldwork archives and in provision of listings of type reference collections, such as the Barton collection of European vernacular pottery (Brears 1998; Dawson 2005).
Section 1.2.7 on museums was prepared by David Dawson and draws upon information from SWMC (2000) and SWMC (2002).